Small and medium-sized businesses (SMBs) inevitably face a distinct and often formidable set of IT audit challenges, primarily stemming from their characteristically limited financial resources, constrained technical personnel, and the frequent absence of a dedicated internal compliance or risk management team, which collectively create a perfect storm of vulnerability when confronting the rigorous and unforgiving demands of modern regulatory frameworks and certification standards.
IT Audit Challenge Landscape for SMBs
Common Challenges and Their Prevalence
| Challenge | Prevalence in SMBs | Typical Impact Level | Average Resolution Time | Key Contributing Factors |
|---|---|---|---|---|
| Limited Budget & Resources | 92% of SMBs | High | 6-12 months | No dedicated compliance staff, competing IT priorities |
| Documentation Deficiencies | 88% of SMBs | Medium-High | 3-6 months | Viewed as administrative burden, lack of templates |
| Third-Party Risk Management Gaps | 76% of SMBs | Medium | 4-8 months | Heavy vendor reliance, no formal assessment process |
| Inadequate Access Controls | 82% of SMBs | High | 2-4 months | Ad-hoc provisioning, no quarterly reviews |
| Incident Response Gaps | 71% of SMBs | Very High | 4-6 months | No formal plan, lack of testing |
| Regulatory Complexity | 68% of SMBs | Medium-High | Ongoing | Multiple frameworks, evolving requirements |
Budget Allocation Comparison: SMBs vs Enterprises
| Security Category | SMBs (% of IT Budget) | Enterprises (% of IT Budget) | Critical Gap Areas |
|---|---|---|---|
| Compliance Tools | 3-5% | 8-12% | Automated GRC platforms |
| Security Personnel | 5-10% | 15-25% | Dedicated compliance staff |
| Technical Controls | 15-20% | 20-30% | Advanced threat protection |
| Training & Awareness | 1-2% | 3-5% | Regular phishing simulations |
| Incident Response | 2-4% | 5-8% | IR retainer services, testing |
| Vendor Risk Mgmt | 1-2% | 4-7% | Assessment tools, audits |
ROI of Common Compliance Investments for SMBs
| Investment | Typical Cost (Annual) | Time to Value | Key Benefits | Risk Reduction |
|---|---|---|---|---|
| vCISO Services | $15k-$40k | 1-3 months | Strategic leadership, audit prep | 40-60% |
| Automated GRC Platform | $5k-$15k | 2-4 months | 60% time savings on evidence collection | 30-50% |
| MFA Implementation | $2k-$8k | 1-2 months | Prevents 99.9% account compromises | 80-90% |
| Security Awareness Training | $1k-$5k | 3-6 months | Reduces phishing success by 70% | 50-70% |
| Vulnerability Management | $3k-$10k | Immediate | Identifies critical vulnerabilities weekly | 60-80% |
Detailed Examination of Primary IT Audit Challenges
1. Severely Limited Budget and Skeletal In-House Resources
Impact Analysis:
Budget Constraint Severity:
High ────────────────────────────────────────┐
Medium ──────────────────────────────┐        │
Low ──────────────┐                  │        │
                  │                  │        │
              Personnel       Tools/Software  Training
Solution Strategy Matrix:
| Approach | Implementation Time | Cost Range | Effectiveness | Best For |
|---|---|---|---|---|
| Automated Compliance Tools | 2-4 weeks | $5k-$15k/year | High | Tech-savvy teams with multiple frameworks |
| Virtual CISO (vCISO) | 4-6 weeks | $15k-$40k/year | Very High | SMBs with <50 employees, no security staff |
| Managed Security Services | 6-8 weeks | $20k-$50k/year | High-Medium | 24/7 coverage needs, limited in-house skills |
| Compliance-as-a-Service | 2-3 weeks | $10k-$25k/year | High | Specific framework compliance (SOC 2, ISO) |
2. Documentation Deficiencies: The Evidence Gap
Documentation Implementation Roadmap:
| Phase | Timeline | Key Deliverables | Success Metrics |
|---|---|---|---|
| Foundation | Months 1-3 | Core policy templates, basic inventory | 80% policy coverage, centralized repository |
| Expansion | Months 4-6 | Procedure documentation, role definitions | All critical systems documented, RBAC implemented |
| Maturation | Months 7-9 | Control matrices, evidence mapping | Audit evidence ready for 70% of controls |
| Optimization | Months 10-12 | Automated evidence collection, integration | 90% automated evidence, quarterly reviews established |
3. Third-Party Risk Management Evolution
Vendor Risk Classification Framework:
| Risk Tier | Criteria | Assessment Frequency | Required Evidence |
|---|---|---|---|
| Critical | Direct data access, essential service, high integration | Quarterly | SOC 2 Type II, security questionnaire, onsite audit rights |
| High | Indirect data access, important service, moderate integration | Semi-Annually | SOC 2 Type I, detailed questionnaire, contract review |
| Medium | Limited data access, supportive service, minimal integration | Annually | Basic questionnaire, insurance verification |
| Low | No data access, commodity service, no integration | Biannually | Contract terms review only |
4. Access Control Implementation Road Access:
| Metric | Target | Current (Typical SMB) | Gap | Action Required |
|---|---|---|---|---|
| Quarterly Review Completion | 100% | 40% | 60% | Automate reminders, assign owners |
| Dormant Account Identification | <1% | 15% | 14% | Implement 90-day inactivity lockout |
| Over-privileged Accounts | <5% | 35% | 30% | RBAC refinement, least privilege enforcement |
| MFA Coverage | 100% | 45% | 55% | Phased rollout, executive sponsorship |
| Separation of Duties Conflicts | 0 | 8-12 conflicts | High | Define and enforce SoD matrix |
5. Incident Response Capability Building
Incident Response Testing Results Analysis:
| Scenario | Detection Time (Target) | Actual (First Test) | Gap | Improvement Actions |
|---|---|---|---|---|
| Ransomware Attack | <15 minutes | 4 hours | 3h 45m | Implement EDR, better logging |
| Data Breach | <1 hour | 8 hours | 7 hours | Deploy DLP, improve monitoring |
| Phishing Incident | <30 minutes | 2 hours | 1h 30m | User training, better email filtering |
| Insider Threat | <4 hours | 24+ hours | 20+ hours | Implement UEBA, improve access reviews |
Industry-Specific Compliance Framework: Solar Energy Sector
Solar Energy Compliance Requirements Matrix
| Regulation/Standard | Applicability Threshold | Key Requirements | Typical Audit Frequency | SMB Cost Impact |
|---|---|---|---|---|
| NERC CIP (if applicable) | >75MW generation | Physical security, access controls, incident response | Annual | High ($50k-$150k) |
| State Privacy Laws | Varies by state | Customer data protection, breach notification | Trigger-based | Medium ($10k-$30k) |
| FERC Standards | Interconnected systems | Reliability standards, reporting | Annual/Biennial | Medium-High ($25k-$75k) |
| Industry Certifications | Voluntary | Best practices, quality standards | 1-3 years | Medium ($15k-$40k) |
Field Operations Security Metrics Dashboard
| Security Control | Implementation Rate | Compliance Target | Risk Reduction | Next Review |
|---|---|---|---|---|
| Encrypted Field Devices | 45% | 100% (Q4 2024) | 65% data loss risk | October 2024 |
| Secure Data Transmission | 60% | 95% (Q3 2024) | 80% interception risk | September 2024 |
| Physical Security Training | 30% | 90% (Q2 2024) | 50% theft risk | June 2024 |
| GPS Asset Tracking | 75% | 100% (Q1 2024) | 85% recovery rate | March 2024 |
| Remote Wipe Capability | 55% | 100% (Q4 2024) | 90% data exposure risk | November 2024 |
Cost-Benefit Analysis of Compliance Investments
Three-Year Compliance Program ROI Projection
| Year | Investment | Labor Savings | Risk Reduction Value | Audit Cost Avoidance | Total ROI |
|---|---|---|---|---|---|
| 1 | $45,000 | $15,000 | $25,000 | $10,000 | $5,000 |
| 2 | $35,000 | $25,000 | $40,000 | $15,000 | $45,000 |
| 3 | $30,000 | $35,000 | $60,000 | $20,000 | $85,000 |
| 3-Year Total | $110,000 | $75,000 | $125,000 | $45,000 | $135,000 |
Note: Risk reduction value calculated based on average breach costs for SMBs ($120,000) and probability reduction.
Implementation Priority Matrix (Eisenhower Method)
| Quadrant | High Impact/Urgent | Low Impact/Urgent |
|---|---|---|
| High Impact/Low Urgent | 1. MFA Implementation 2. Critical Vulnerability Patching 3. Incident Response Plan | 4. Employee Security Training 5. Quarterly Access Reviews |
| Low Impact/Low Urgent | 6. Advanced Threat Hunting 7. Full Network Segmentation | 8. Comprehensive Risk Assessment 9. Vendor Risk Program |
Implem
Quarterly Progress Tracking Framework
| KPI | Q1 Baseline | Q2 Target | Q2 Actual | Q3 Target | Variance |
|---|---|---|---|---|---|
| MFA Adoption Rate | 15% | 45% | 42% | 75% | -3% |
| Critical Patch Compliance | 65% | 85% | 88% | 95% | +3% |
| Security Training Completion | 20% | 60% | 55% | 90% | -5% |
| Access Review Completion | 10% | 50% | 48% | 80% | -2% |
| Incident Detection Time | 8 hours | 4 hours | 3.5 hours | 2 hours | +0.5 hours |
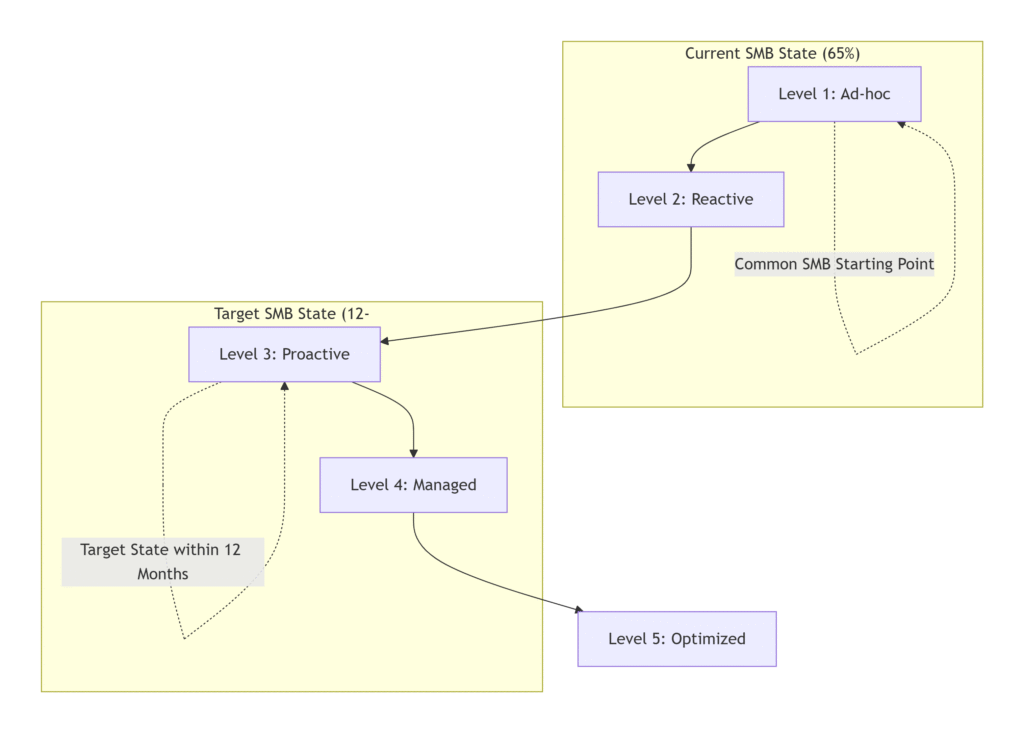
Strategic Roadmap: 12-Month SMB Compliance Transformation
Resource Allocation Projection
| Resource Type | Phase 1 (Months 1-4) | Phase 2 (Months 5-8) | Phase 3 (Months 9-12) |
|---|---|---|---|
| Internal IT Hours/Month | 40-60 hours | 30-40 hours | 20-30 hours |
| External Consultant Hours | 20-30 hours | 15-20 hours | 10-15 hours |
| Software/Tools Budget | $5,000-$8,000 | $3,000-$5,000 | $2,000-$3,000 |
| Training Budget | $1,000-$2,000 | $2,000-$3,000 | $1,000-$2,000 |
Conclusion: Building Sustainable Compliance
The journey from audit anxiety to audit confidence requires systematic planning, strategic investment, and consistent execution. By leveraging the frameworks, matrices, and visual roadmaps provided, SMBs can transform compliance from a disruptive, reactive expense into a strategic advantage that builds customer trust, reduces operational risk, and creates tangible business value. Remember that each incremental improvement builds upon the last, creating a compounding effect that makes future audits progressively easier and less costly.
Final Strategic Insight: The most successful SMB compliance programs are those that integrate security and compliance into the business workflow rather than treating them as separate, isolated functions. By making security “business as usual,” you not only pass audits but also build a more resilient, trustworthy, and competitive organization.
Contact us now